One of the most popular free stock charting software available on the internet is TradingView.com. It has gained popularity in line with the demand for online stock trading.
For the United States (U.S.) stock market itself, the total market capitalization as of June 2023 is valued at $46,199,811.4 million and has become the largest stock market in the world.
Most people have gained knowledge in the stock market and the interest brings the people to learn more about it. Thanks to the stock trading tool which helps us to learn, filter and choose the best stock available in the market.
For example, TradingView.com is a popular online platform that provides advanced charting and analysis tools for traders and investors. It allows users to access real-time data on various financial instruments such as stocks, cryptocurrencies, forex pairs, commodities, etc.
TradingView offers a user-friendly interface with customizable charts, technical indicators, and drawing tools, making it easy for traders to analyze market trends and patterns.
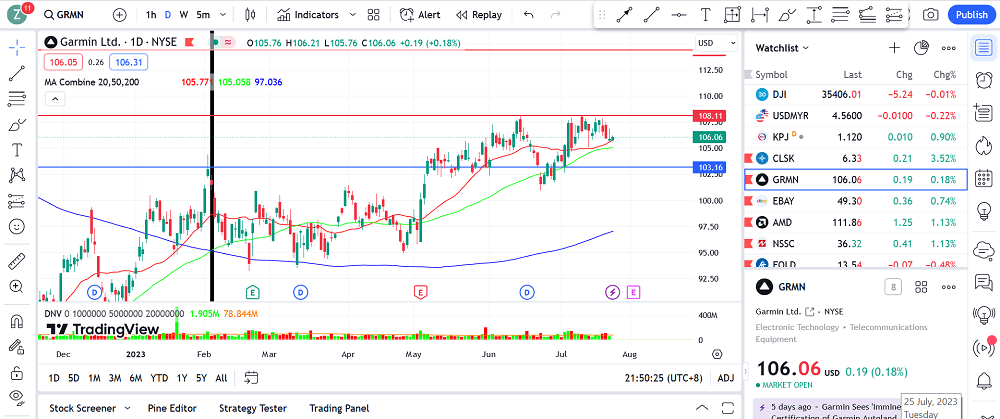
TradingView.com light interface mode
Users can also share their trading ideas and analysis with the community through published charts and ideas.
The platform is not only used for technical analysis but also for social networking among traders. Users can follow each other, discuss trading strategies, and exchange insights within the community.
The Free Account for TradingView.com
When it comes to sophisticated, complex, and full features of info, it will come with a cost. But, as traders who might want to have very basic charting software, it also offers for free.

TradingView.com dark interface mode
The free account on TradingView comes with several limitations compared to the paid plans. The paid plans are known as the Pro, Pro+, and Premium plans. Here are some of the main limitations of the free account:
1. Limited Number of Indicators
Free users have access to a limited number of technical indicators and overlays compared to the extensive library available to paid subscribers. As for my usage, we can use maximum 3 indicators for technical indicators which is sufficient for beginners.
2. Limited Number of Saved Chart Layouts
Free users can only save a limited number of chart layouts (templates) for quick access.
3. Limited Number of Server-Side Alerts
Free users can set up a limited number of server-side alerts. Server-side alerts are triggered by the platform even if you’re not actively using it at the moment.
4. Delayed Data
Free users may experience a delay of up to 15 minutes for real-time data in certain markets. Paid subscribers, on the other hand, receive real-time data without any delay.
5. Limited Access to Advanced Features
Certain advanced features and tools may be accessible only to paid subscribers. For example, custom time intervals, multiple chart layouts on one screen, and additional customization options are usually reserved for Pro and Premium users.
6. Limited Historical Data
Free users might have access to limited historical data, which could be a potential limitation for conducting in-depth backtesting and analysis.
7. Advertisements
Free users may see ads while using the TradingView platform, which is one of the ways the service supports its free offering.
8. One (1) Watchlist
The free account is only able to create one (1) watchlist of stock listings while paid plan can create multiple watchlists to save more listings.
TradingView.com for Beginner
Although is free stock charting software but as a beginner, using TradingView.com can seem overwhelming at first, but it offers a user-friendly interface that can be easily navigated.
Here are some steps to help you get started:
1. Create an Account
Visit the TradingView website and sign up for a free account if you don’t already have one. You can use your email or social media accounts to register.
2. Explore the Interface
Take some time to familiarize yourself with the different elements of the TradingView interface. You’ll find charting tools, technical indicators, drawing tools, and other features.
3. Select a Market
Decide which financial market you want to analyze (e.g., stocks, cryptocurrencies, forex, commodities). You can search for specific symbols or instruments in the search bar.
4. Add a Chart
Once you’ve chosen a market, click on the “+” icon at the top to add a chart. This will open a new chart window where you can customize the settings.
5. Customize the Chart
On the chart window, you can customize the time frame (e.g., 1D for daily, 1H for hourly), add technical indicators (e.g., Moving Averages, RSI, MACD), and use drawing tools (e.g., trendlines, support, and resistance).
6. Analyze the Data
Use the chart and technical indicators to analyze the data and identify potential trends or patterns. You can also change the chart style and apply different studies for a better understanding of the market.
7. Save and Share
If you want to save your analysis or share it with others, you can save the chart layout and publish your ideas on TradingView’s community platform.
8. Explore Community Ideas
TradingView has a vibrant community where users share their trading ideas and analysis. Explore these ideas to learn from others and gain insights into different trading strategies.
9. Use Educational Resources
TradingView offers various educational resources, tutorials, and guides to help beginners understand the platform and improve their trading skills.
Remember that trading involves risks, and it’s essential to educate yourself and practice with caution. As a beginner, focus on learning the basics of technical analysis, risk management, and trading strategies to improve your skills over time.
Always start with a demo account or trade with small amounts until you feel confident in your abilities.
Additionally, as for start, you may refer to below YouTube tutorial for reference.
What are the Advantages of TradingView.com Compared to Other Free Stock Charting Software?
TradingView.com offers several advantages compared to other free stock charting software, which has contributed to its popularity among traders and investors.
Here are some of the key advantages:
1. User-Friendly Interface
TradingView has an intuitive and user-friendly interface, making it easy for beginners to get started with charting and technical analysis. The platform’s clean design and straightforward navigation enhance the user experience.
2. Web-Based Platform
TradingView is entirely web-based, which means there’s no need to download or install any software. You can access your charts and analysis from any device with an internet connection, including desktops, laptops, tablets, and smartphones.
3. Social Networking
The platform fosters a social community of traders and investors. Users can follow each other, share ideas, and interact through comments and messages, creating a collaborative environment for learning and discussing trading strategies.
4. Community-Generated Content
TradingView’s community platform allows users to share their analysis, ideas, and trading strategies with others. This content-rich ecosystem provides access to a wide range of market insights and helps traders learn from each other.
5. Wide Market Coverage
TradingView supports a broad range of financial markets, including stocks, cryptocurrencies, forex, commodities, indices, and more. This extensive market coverage enables users to analyze various assets all in one place.
6. Advanced Charting Tools
TradingView offers a wide array of advanced charting tools and technical indicators, catering to both beginners and experienced traders. The platform’s flexibility allows users to customize charts according to their preferences.
7. Real-Time Data and Alerts
Paid plans provide users with real-time market data, ensuring timely and accurate analysis. The platform also allows traders to set up alerts based on various conditions, keeping them informed of potential trading opportunities.
8. Collaboration and Sharing
TradingView enables users to collaborate with others in real-time, making it ideal for teams or trading groups who want to work together on analysis and strategies.
9. Continuous Updates and Improvements
TradingView regularly updates its platform with new features, enhancements, and bug fixes. This commitment to development ensures that users have access to a state-of-the-art trading platform.
10. Cross-Device Syncing
With a TradingView account, you can seamlessly sync your saved charts, analysis, and preferences across multiple devices, providing a consistent experience no matter where you access the platform.
It’s important to consider individual needs and preferences when choosing stock charting software. While TradingView has many advantages, other platforms may have specific features or capabilities that better suit certain traders or investors.
Therefore, it’s recommended to explore different options, try out free trials, and assess which platform aligns best with your trading goals and style.
If you need access to more advanced features and real-time data, you can consider upgrading to a paid subscription plan.